4.1 Diagram Editor
The Diagram Editor
is a tool for
creating, managing and maintaining graphs as
diagrams.
With a Diagram Editor you can view and edit graphs as well as make or view
explosions and decompositions between several graphs. Basically, except for the
notation of the selected modeling language, the tool always looks the same. For
example, in
Figure 4-1 we have two
Diagram Editors open, containing different types of graph, i.e. graphs from
different languages.

Figure 4-1. Two Diagram Editors.
Diagram Editor window
The Diagram Editor window (
Figure 4-2) consists of five parts: menu
bar, toolbar area, drawing area, sidebar and status bar.
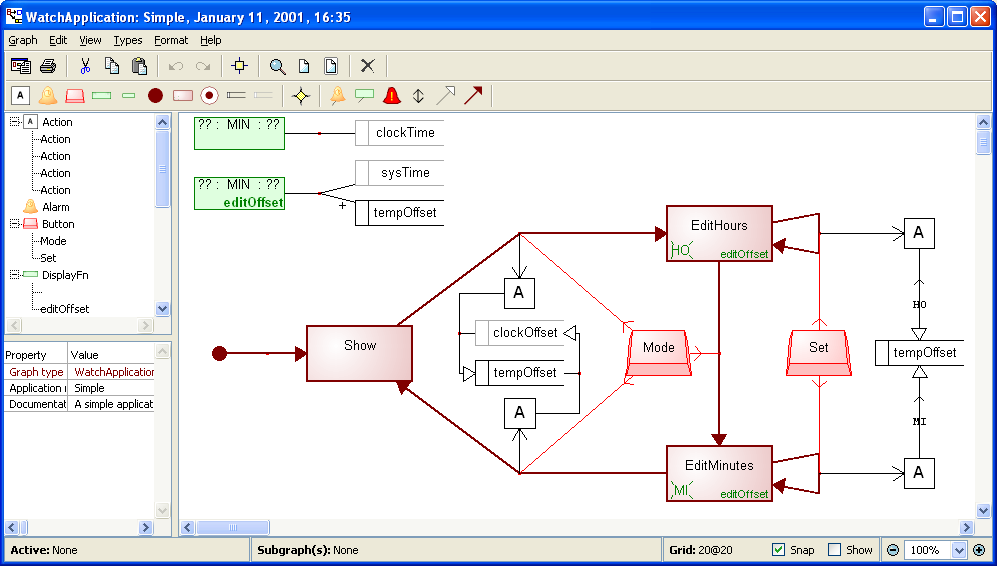
Figure 4-2. Diagram Editor.
The toolbar area can show up to
three toolbars: action tools, object types and relationship types (
Figure 4-3). The object and relationship
toolbars change according to the current language to show the available object
and relationship types in that language. The commands on the action toolbar are
fixed, and are (from left to right):
Generate,
Print,
Cut,
Copy,
Paste,
Undo,
Redo,
Align to Grid,
Zoom ,
Default Zoom,
Zoom to Fit and
Delete.
Depending on the modeling language and generator definitions in use, buttons for
executing specific generators may also appear on the action toolbar. They will
be grouped on the right side of the
Delete button.
The buttons in the object type and relationship type
toolbars represent the types of the current modeling language, and therefore
change from language to language. Pressing these buttons will initiate the
creation of the respective object or relationship type. Please note that there
is also a separate generic relationship button, ‘Rel’, between the
object and relationship buttons. This initiates the creation of any relationship
type: the type of the relationship instance is determined from context, or
prompted from the user when the creation is confirmed.
The visibility of the toolbars in each Diagram Editor
window can be set from the
View | Toolbar menu. Default visibility and
layout of toolbars can be set in the Options Tool (see Section
3.1.3).

Figure 4-3. Diagram Editor toolbars.
The drawing area is
the main component of the Diagram Editor, and is used for creating and managing
diagram elements. Diagram elements are graphical representations of conceptual
model elements such as objects or relationships. The sidebar on the left side of
the Diagram Editor provides an alternative interactive tree-view to the design
data shown in the drawing area. The status bar at the bottom of the window shows
the currently active diagram element and its sub-graphs, the grid setting and
current zoom factor.


