5.2.2 Documentation generation
Design information can be published from MetaEdit+ to other
applications, allowing you to review
designs and document a project.
MetaEdit+ has pre-defined project and graph documentation generators which
create HTML
files for web browsers and a .DOC or .RTF document file for Microsoft
Word.
Graph documentation
Graph
documentation
is available for all
graphs. The graph documentation generator outputs a single graph into a file.
Graph documentation includes:
 | Information
about the graph name, graph status, personnel who have worked on the graph and
free-form graph documentation. These are retrieved from the graph’s
properties, and are thus only available for graph types that define matching
properties. |
| If
there is a diagram representation, a picture of the diagram. The picture in HTML
documentation is a PNG file with a clickable image map.
|
| A
short table of contents of the graph, including object names and their
documentation. |
| Detailed
descriptions of each object: its name, properties, links to other objects and
possible explosion or decomposition
links. |
| The
Word document also includes a cover page with the status of the graph
documented, generation date, author of file (from Word), and document file
name. |
To create documentation for a
graph:
| 1) | Select
any graph (e.g. ‘2008Models’) in the Graph Browser in the Launcher.
|
| 2) | Press the
Generate button in the Launcher toolbar. Alternatively, open the pop-up
menu with the right mouse button and select
Generate.... |
| 3) | Choose
‘Export graph to HTML’ or ‘Export graph to
Word’. |
Depending on your choice the
generated Graph documentation is opened in a web browser or Word.
 | Note
that the generated files are stored by default in the reports
subdirectory of the MetaEdit+ startup directory. The location is specified in
the ‘_default directory’
generator. |
Project documentation
In addition to documenting individual graphs, documentation
can be created for the whole
project
. For this purpose the
graphs that you want to document for the project must be defined with a Project
Model (see
Figure 5-4). Project
Model
is a specific modeling technique for illustrating
the graphs belonging to a certain project, the relationships between graphs, and
any subprojects of this project. Subprojects can be decomposed into other
Project Models.
| The
Project Model graph type is defined in the demo repository. Note that the
Project Model graphs are not created automatically, but must be created and
maintained manually. You can thus have several Project Models to generate
different sets of documentation, e.g. one for the analysis phase and another for
the design phase. |
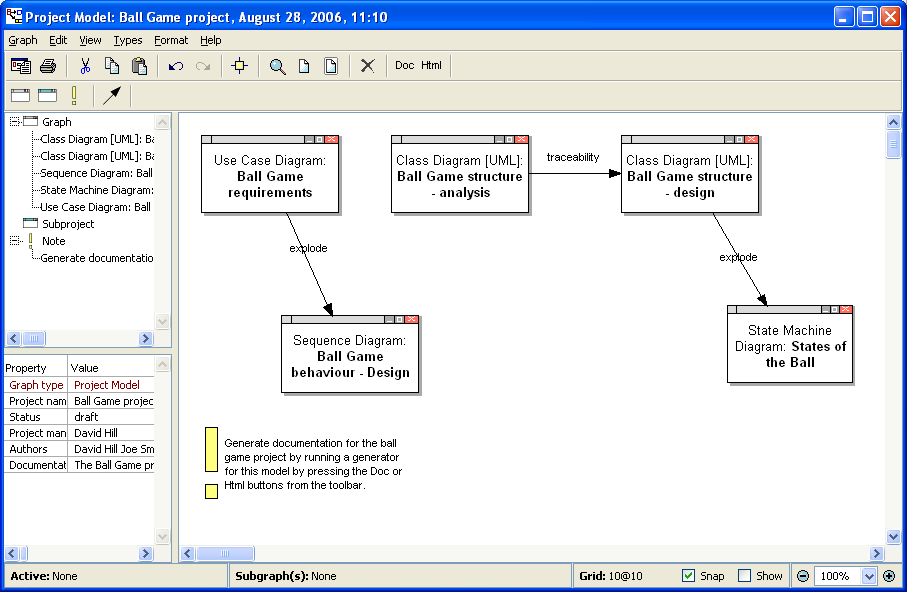
Figure 5-4. An example of a Project Model.
As with graph
documentation, the project documentation generators can produce HTML files or a
Word document file. The Export to HTML and Export to Word documentation
generators create the following information:
| The
Project name and description, its current status, the project manager, and the
personnel involved, with their contact details. All this information is
retrieved from the Project Model’s own
properties. |
| If
there is a diagram representation, a picture of the diagram. For HTML
documentation the picture is a PNG file with a clickable image
map. |
| A
dictionary of the graphs belonging to the Project Model, along with their
descriptions. Each graph name forms a hyperlink to its detailed documentation,
generated with the corresponding Graph Documentation generator. For HTML, each
graph is generated to a separate HTML file; for Word, each is generated as part
of the whole project file. |
Hence, project
documentation creates documentation pages for a selection of graphs for the
whole project. The Word document file
also includes a cover page with document information, and
a table of contents.
To create project documentation:
| 1) | Create
a Project Model graph (make sure you are in the ‘demo’ repository
and have opened the ‘mcc’ project, where the Project Model graph
type is
defined). |
| 2) | Enter
information about the project (such as name, personnel etc.) to the graph
properties.
|
| 3) | Open the
Project Model as a
diagram. |
| 4) | Add
new graph objects to the Project Model, attaching existing graphs as their
properties (see Section 3.3.1 for
Property Dialog
functions). |
| You
may also create relationships between graph objects and define
subprojects. |
| 5) | Generate
project documentation by running either ‘Export to HTML’ or
‘Export to Word’. |
As a result, the
generator creates documentation files and opens them in a web browser (
Figure 5-5) or in Word, if your system
supports this.

Figure 5-5. Browsing HTML-based project documentation.


