5.1.2 Executing and debugging generators
Having defined our first generator, it is now time to see it
in action. To run the generator, press the Generate button in the toolbar
(or Ctrl+R or Generator | Generate from the menu bar). When
prompted for the Graph to run the generator on, select ‘Simple’
(subsequent runs will remember this choice):
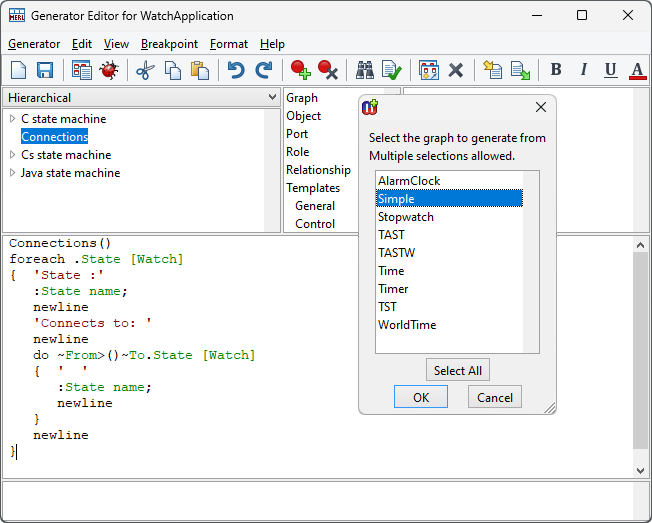
Figure 5–3. Executing a generator.
MetaEdit+ will now
execute the generator for the selected graph and open a window with the
generator output:
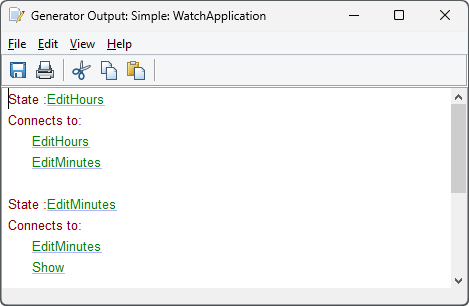
Figure 5–4. Example generator output for ‘Simple’.
While
it is not usually recommended to manually change the generator output, the
Generator Output window nonetheless provides such elementary text editor
features as cut/copy/paste, saving and printing. In many cases the Generator
Output window is not opened at all, as the generator output is all written to a
file; in that case a Generated Files window lists the resulting files, allowing
you to look at their contents in MetaEdit+ or open them in their default
application.
The Generator Editor also provides an advanced debugging
toolset to ease generator development. The detailed documentation for the
Generator Debugger can be found in Section
5.4; here we will just look briefly at its
basic features. The debugger enables us to trace the execution of the generator
line-by-line, set breakpoints at critical parts of our code, and view the
current execution context stack as well as the variables and their
values.
To debug the execution of a generator, start the
generation by pressing the
Debug button in the toolbar or selecting
Generator | Debug... from the menu, and select the graph you want to
execute the generator for from the list that opens (in our example, we pick
‘Simple’). The Generator Debugger will open, loaded with the code of
the selected generator as shown in
Figure
5–5:
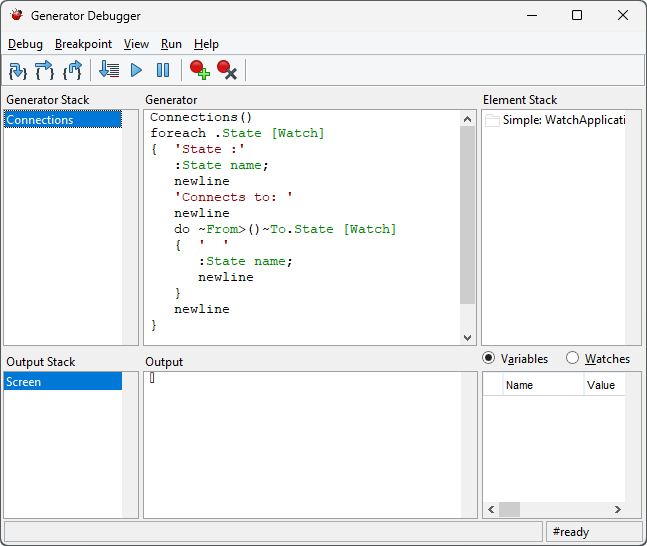
Figure 5–5. Generator Debugger.
The commands for
tracing the generation execution are grouped on the left-hand side of the
toolbar and in the Debug and Run menus, while the operations for
setting and removing execution breakpoints can be found on the right-hand side
of the toolbar or in the Breakpoint menu. To try them out, place the
cursor at the beginning of the line that says
do ~From>()~To.State [Watch]
and press the Add
Breakpoint button in the toolbar (or select Breakpoint | Add from the
menu). This will place the breakpoint just before the
do loop. Now, execute the generator up
to this breakpoint by pressing Run button in the toolbar (or by selecting
Run | Run). The Generator Debugger will now look like this:
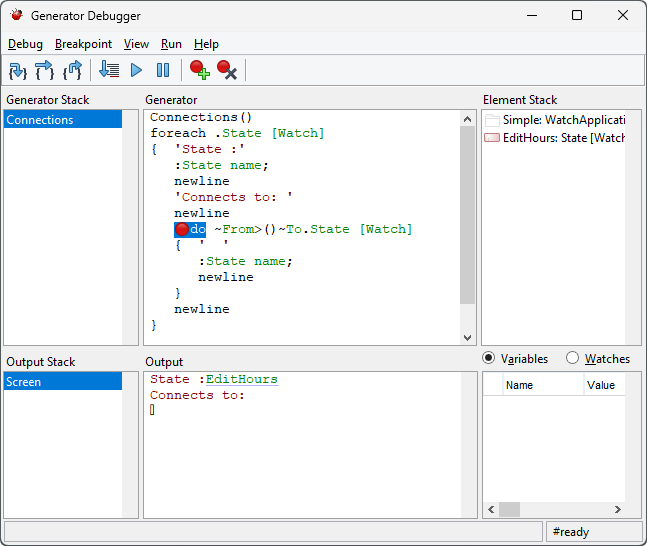
Figure 5–6. Debugging a generator.
As can be seen
above, the Debugger Editor now shows an execution snapshot taken at the
breakpoint. The next command to be executed is shown with selection highlighting
next to the breakpoint in the Generator pane, while the various panes
around it provide a view of the execution context and stacks. The generator
output produced so far is shown in the Output pane. To proceed onwards
step-by-step, press the Step Into button in the toolbar (or F5 or
Debug | Step Into from the menu bar). While doing this, you will see the
Output pane and other panes update, as more output is generated and the
context changes according to the currently accessed model element. The other
options provided for execution tracing are Step Over (F6 or
Debug | Step Over), Step Out (F7 or Debug | Step
Out), Run to Cursor (F8 or Debug | Run to Cursor),
Run (F9 or Run | Run) and Break (F10 or
Run | Break).
The Generator Editor and Debugger also provide several
ways to use and manage the execution breakpoints. The toolbars on both tools
provide simple buttons for adding and removing the toolbars and more advanced
operations (like setting condition for the breakpoint or enabling/disabling
them) can be found from the
Breakpoint
menu.


