2.6.2 Trying out visual debugging
As the API callbacks for the visual debugging have been
incorporated into the code, we need to generate and compile our sample watch
models again. Depending on your target language, set the
Generation target
platform to either ‘C#: API’ or ‘Java: API’ in the
property dialog for the ‘WatchModels’ graph, and run the
‘Autobuild’ generator. Once the code has been generated and
compiled, the generation process will automatically start the MetaEdit+ API tool
(shown in
Figure 2-16) to provide the
SOAP server to send the external requests to.
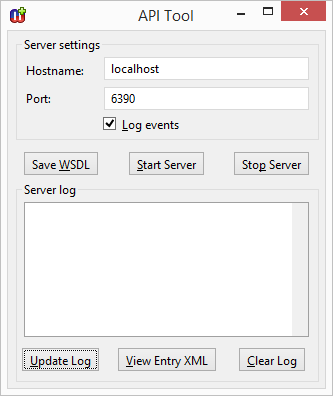
Figure 2-16. The API tool.
After that the familiar test
environment will start again and you can choose which watch model you want to
test. Activating and trying out the watch model will now visualize the execution
by highlighting the active state in the diagram (as in
Figure 2-17). Thus, you can now run watch
applications and follow their execution through the models.
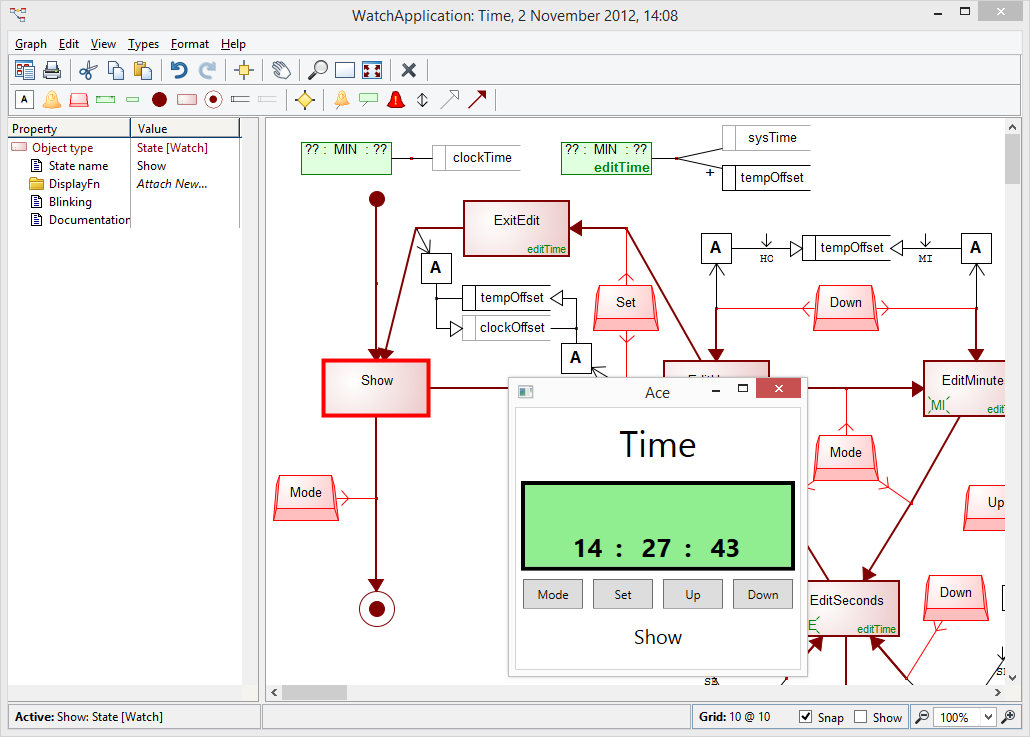
Figure 2-17. Visual debugging of a watch application.
How
does it work, then? The basic implementation idea of our visual debugger is very
simple: at the end of each state transition, a SOAP message requesting
highlighting of the next state in the model is sent to the SOAP server running
in MetaEdit+. MetaEdit+ processes the message, highlights the requested element
and sends an acknowledging SOAP reply back to the client application. For more
information about the actual implementation of the visual debugger, see Section
4.1.1 ‘
Visual Debugging with C#’ or
Section
5.1.1 ‘
Visual Debugging with Java’
depending on your target language.


