5.2 Visual Debugger for the Watch Example
The Watch example distribution already contains an
implementation of a visual debugger. To try it out, set the
Generation target
platform to ‘API’ in the property dialog for the
‘2008Models’ graph, make sure that API server is started and all
browser windows are closed, and run the ‘Autobuild’ generator. The
test environment will start the web browser again, and you can choose which
watch model you want to test. When you activate the watch model and play around
with it, the test environment will make a SOAP call to MetaEdit+, opening the
diagram for the state machine that is being executed and highlighting the active
state in the diagram (as in
Figure 5-2).
Thus, you can now run watch applications and follow their execution through the
models.
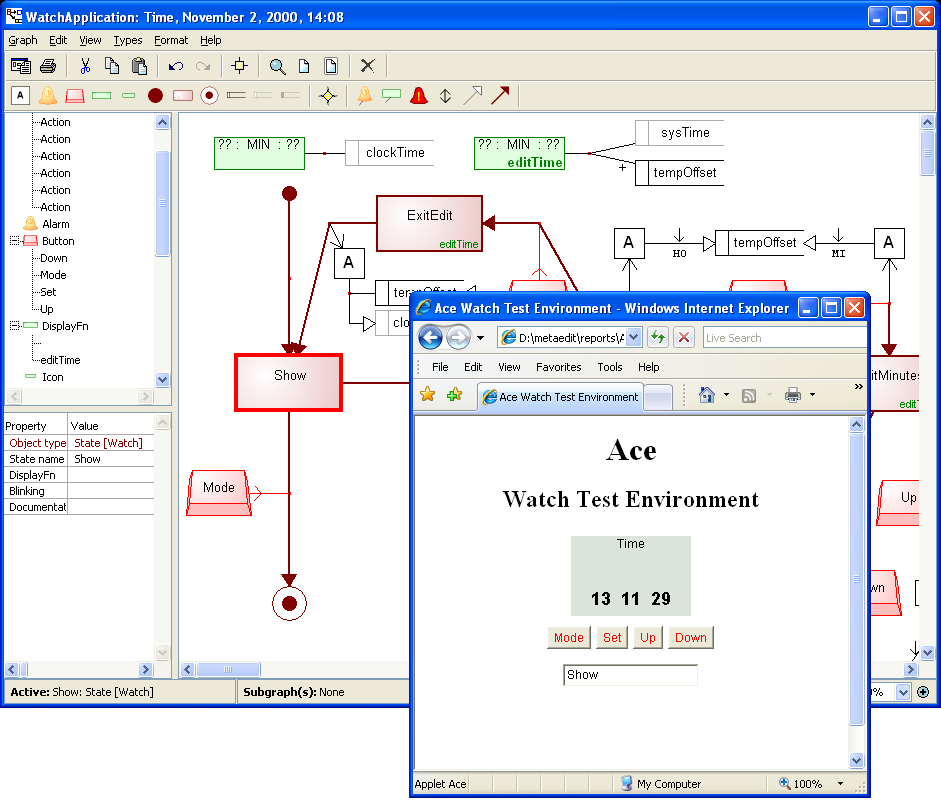
Figure 5-2. Visual debugging of a watch application.
How
does it work, then? As the general behavior of animation (i.e. highlighting the
target state after a state transition) remains the same for all elements, we
found it most feasible to implement it as a framework feature. Therefore,
API-specific versions of Master and AbstractWatchApplication framework Java
components were created. It took one day from one developer to make these
extensions. The ultimate benefit of this solution is of course that there were
no changes in models and only a minimum amount of changes in code generators
(i.e. we had to create new API-specific high-level ‘_create make for
API’ and ‘_compile and execute for API’ generators).
The basic implementation idea of our visual debugger is
very simple: at the end of each state transition, a SOAP message requesting
highlighting of the specified model element is sent to the SOAP server running
in MetaEdit+. MetaEdit+ processes the message, highlights the requested element
and sends an acknowledging SOAP message back to the client application (this
return message may also contain return values from API operations, but in this
example only a NULL value is returned). For more information about the actual
implementation of the visual debugger, we advise you to study the Java code in
the Master and AbstractWatchApplication framework classes.


