4.3 Table Editor
The Table Editor
(
Figure 4-41) provides a tabular or
form-based view on the objects of a given type in a graph. In the editor, the
objects of a graph are represented as rows and properties of the objects form
columns. Thus, the Table Editor provides an easy way to view all the information
about objects in a graph in a compact form.
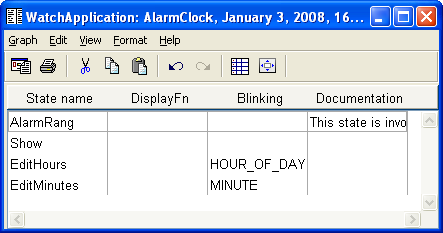
Figure 4-41. Table Editor.
With the Table Editor you can
view and edit properties of objects as well as make or view explosions and
decompositions between several graphs. Hence graphs such as requirements
specifications or problem lists, which are neither graphical diagrams nor
matrices, are most suitable for the Table Editor.
Table Editor window
The Table Editor window (as shown in
Figure 4-41) consists of three parts: menu
bar, toolbar and the table view itself, which is the main area for creating and
managing objects.
Unlike other editors, Table Editor only has an action
toolbar: as each table can only show objects of one type, there is no need for
the objects or relationship types toolbars. The commands on the action toolbar
are (from left to right):
Generate,
Print,
Cut,
Copy,
Paste,
Undo,
Redo,
Autowidth and
Fit
Window to Matrix. Depending on the modeling language used, there may still
be additional quick-access buttons for various generators on the right side of
the toolbar. The visibility of the toolbars in each Table Editor window can be
set from the
View | Toolbars menu. Default visibility and layout of
toolbars can be set in the Options Tool (see Section
3.1.3).


