How to use graphical position information
Printed From: MetaCase
Category:
Forum Name: MetaEdit+
Forum Description: All topics relating to MetaEdit+ or DSM
URL: https://www.metacase.com/forums/forum_posts.asp?TID=7
Printed Date: 27.Mar.2026 at 03:35
Software Version: Web Wiz Forums 12.05 - http://www.webwizforums.com
Topic: How to use graphical position information
Posted By: janne
Subject: How to use graphical position information
Date Posted: 01.Apr.2008 at 14:54
|
A few times there have been questions on how to utilize the position information of objects in models. The MetaEdit+ repository now has an example project, 'Car infotainment', which illustrates the ability to create dynamic, interactive models which automatically update based on changes to their layout.
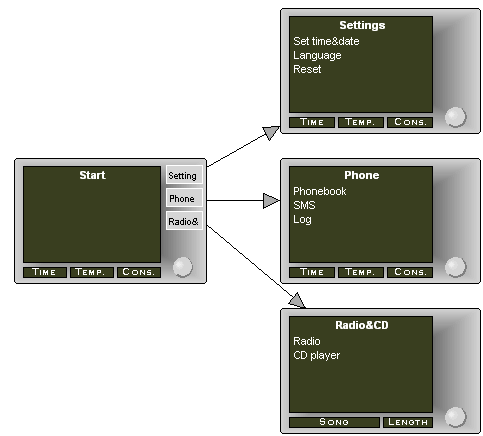 The buttons shown on the right side of the Display object are based on the connections attached to this Display object. The calculation is done with a small generator script called '_number of relationships'
Report '_number of relationships'
$number_of_relationships='0'
do ~From
{
variable '_number_of_relationships' append '+1' close
}
math $_number_of_relationships evaluate
endreport
This script returns the total number of connected objects. Each button element in the symbol (the four areas on the right of the Display object) has its own condition, which specifies whether the button symbol should be drawn (=total number of the connected buttons is greater than or equal to that button element's index, counted from the top).
The Display object also has the constraint of having a maximum of four connections: the device in this example only supported four buttons.
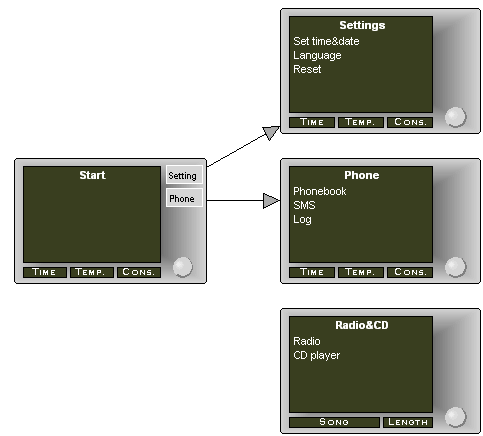
In the next picture the lowest connection is removed from the model and so the 'Radio&CD' button has disappeared from the 'Start' object.
 |
Replies:
Posted By: stevek
Date Posted: 02.Apr.2008 at 01:04
|
Nice example of using position information as the basis for ordering -- and a cool example of how symbols can update dynamically!
Another question people sometimes ask is about visually nesting symbols to show some kind of containment or aggregation relationship. That's also easy to do: to access all contained elements, just use "do contents"; for the reverse, use "do containers". You can see an example of this in the Object Nesting generator in Graph. By default, containment is measured based on the whole symbol area as a rectangle. It's easy enough to add support for things like circles: see this example of http://www.metacase.com/blogs/stevek/blogView?showComments=true&entry=3377872477 - visual containment in VEX .
A key part of all of these examples is that it should be immediately obvious to the user whether a given object is inside another object or not (e.g. just on the edge). With MetaEdit+'s dynamic conditional symbols, that's easy to achieve. For instance, if a symbol is only allowed to exist inside within some container, add a warning icon that is displayed if the output of "containers" is empty. You can see an example of this in the GOPRR project in the MetaEdit+ repository: open the "Structured Analysis and Design" graph and try dragging the "Process" object outside its container.
|
Posted By: janne
Date Posted: 02.Apr.2008 at 16:00
|
Another challenge with the ‘Car infotainment’ sample is how to
have correct Button label in the right button. This requirement is also filled with
the generator script and utilizing the connected object’s vertical position
information. You can inspect these in more detail by opening the Display object’s
definition in the Symbol Editor and then double-click the button label text.
For example the second button label is created with
following script:
$connected_objects='1'
do ~From~To.(); orderby y num
{
variable 'current_index'
write
math
$connected_objects evaluate
close
if $'current_index
='2' then
:Name
endif
variable 'connected_objects'
append '+1' close
}
Script goes through all the connected relationships&objects
with a do loop. Do loop has an argument ‘orderby y num’ which sorts all the connected
objects according their y coordinate. In this specific case label for the
second button will be produced when the ‘current_index’ variable value equals
‘2’.
Every button label has an own similar script. These scripts (in
the symbols) are evaluated automatically, so any event (changing the property field
value, moving the object, adding new object, …) will have it’s immediate
results on display in the model.
To test this:
Select the “Settings" Display object (at the top) and
move it to the bottom. The button labels in the “Start” Display object (on the right)
will be reordered (according the vertical ‘y’ coordinates of the connected
objects).
|
Posted By: hidas
Date Posted: 25.Oct.2012 at 12:00
I just realized that the measurement is based on rectangles. That VEX circle example points way for workarounds but is there a way to handle arbitrarily shaped symbols? Say, is there a way to go through connectable polygon boundaries and see if they cross? |
 stevek wrote:
Posted By: stevek
Date Posted: 25.Oct.2012 at 13:52
Sure, although I don't think the connectable is necessarily the right answer. You can just use whatever series of points you consider to be the edge of the objects, and do the calculations with math...evaluate. The calculation can be done in O(n log n) with a http://stackoverflow.com/a/3018039 - polygon intersection and point-in-polygon test. You probably want to optimize by doing a quick rectangle-based sanity check first. The actual coding - and the subsequent extension to spline intersection
|